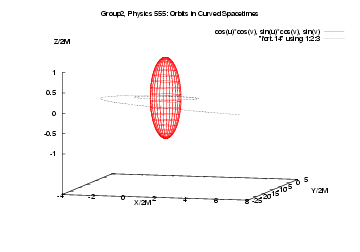
In the previous section we showed how the software handles a single particle in 3 dimensions constrained to move in 2-dimensional slice of space (we picture the event horizon as a red sphere in the center2
This was more for calibration purposes than anything else. Now we will move on to the problem of a cloud of particles moving in a fully 3+1 dimensional space-time.
In order to do this we use a perl script to first generate initial data. The initial data can be as random as necessary or conform to some configuration like a disk or sphere. The routine runs the fortran routine with the LSODA solver and only one time step is taken. This is repeated for all other particles, after which we move onto the next time step. Doing it this way makes it so we do not have to manipulate the data structure too much back in the perl script.
With a cloud composed of thousands of particles and time step of order ![]() the number of calls which will have to be made to the integrator is of order
the number of calls which will have to be made to the integrator is of order ![]() . This makes real time visualization of the dust movement difficult. For a system of 10000 particles and running for 1200 time steps on a 3.2Ghz machine took roughly 6 hours to complete. For such a system real time visualization will not be possible with this implementation.
. This makes real time visualization of the dust movement difficult. For a system of 10000 particles and running for 1200 time steps on a 3.2Ghz machine took roughly 6 hours to complete. For such a system real time visualization will not be possible with this implementation.
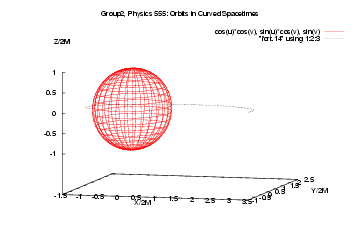
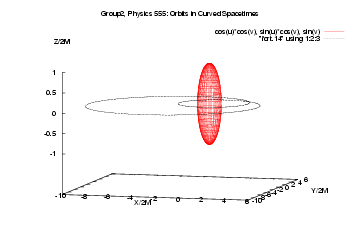
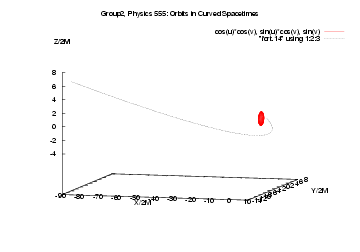
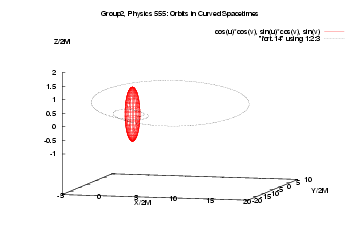
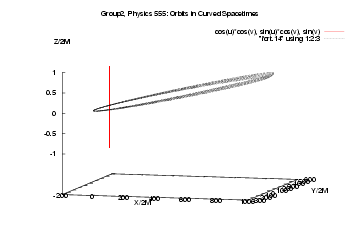
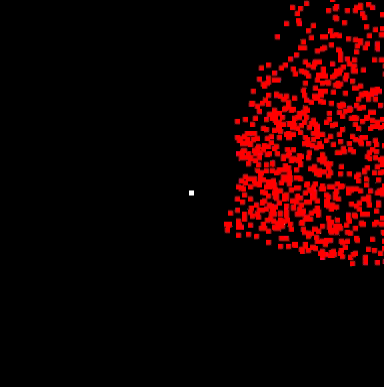
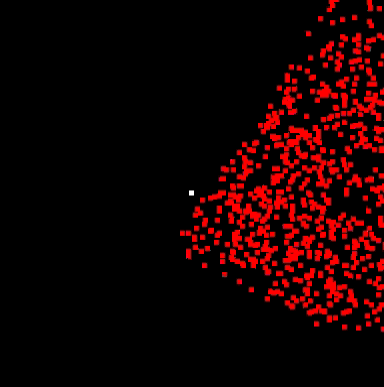
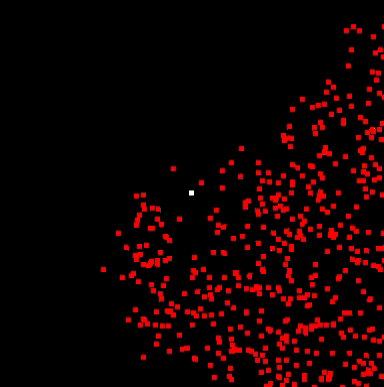
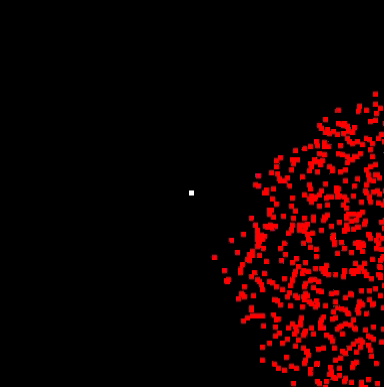
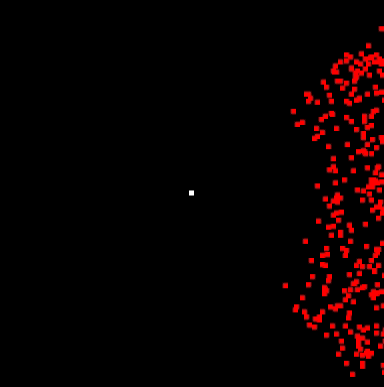
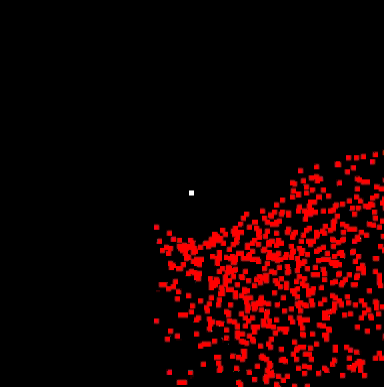
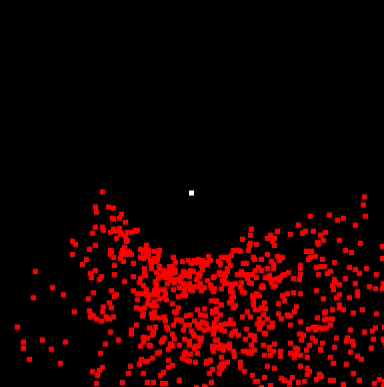
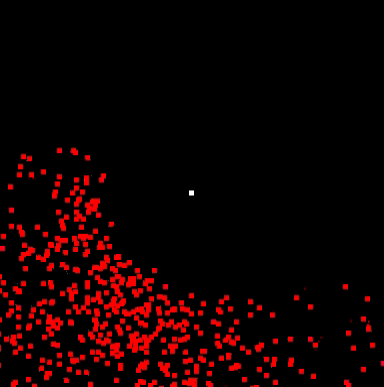
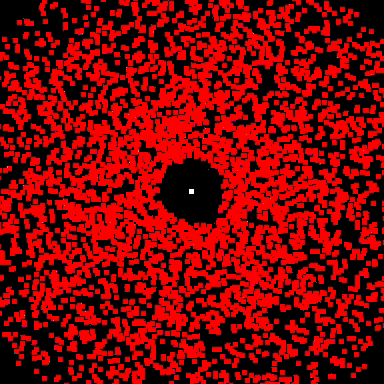
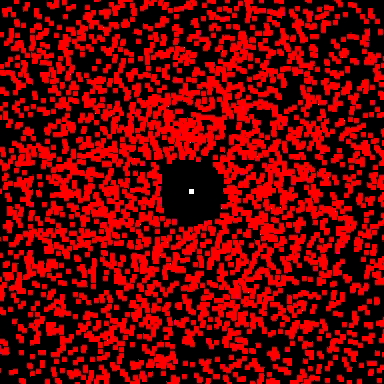
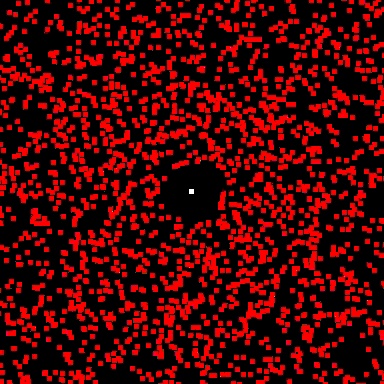
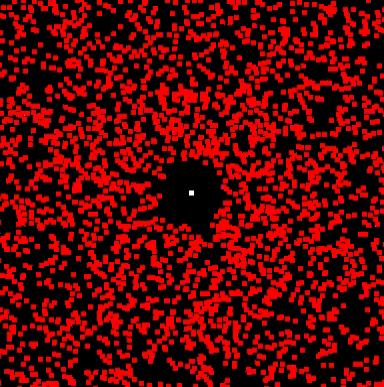
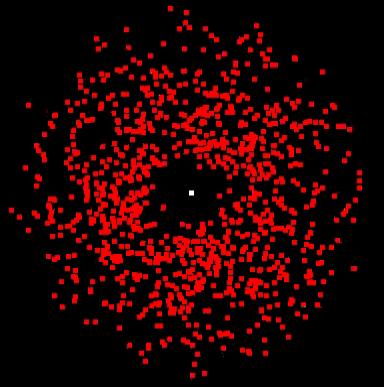
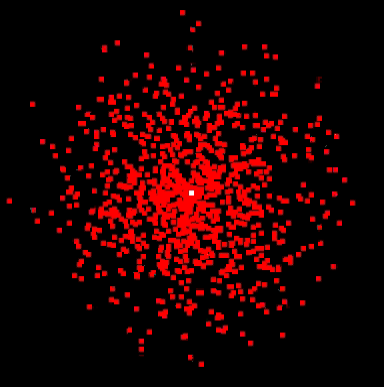
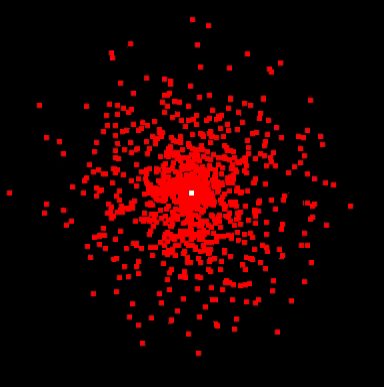
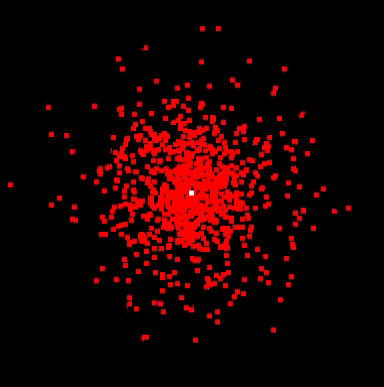
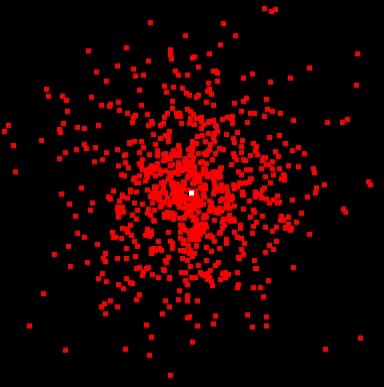
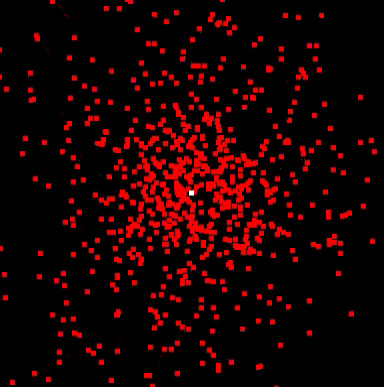
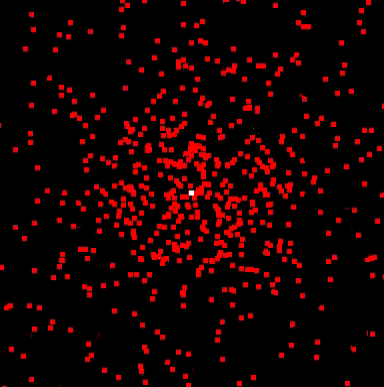
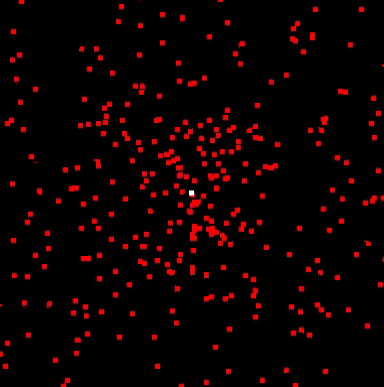
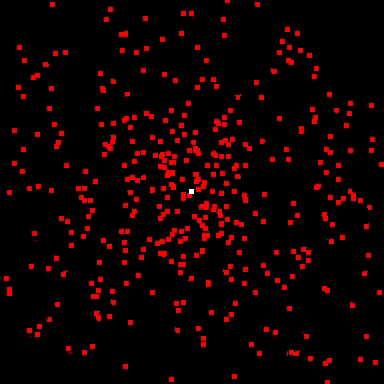
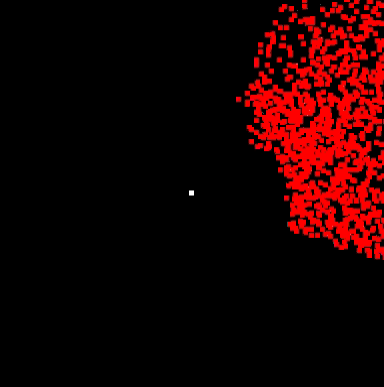
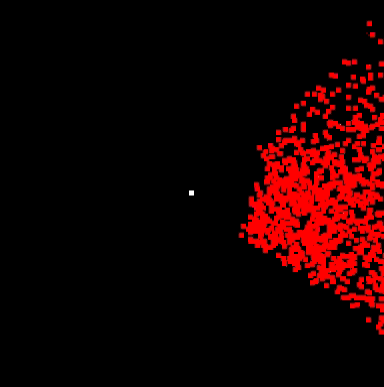
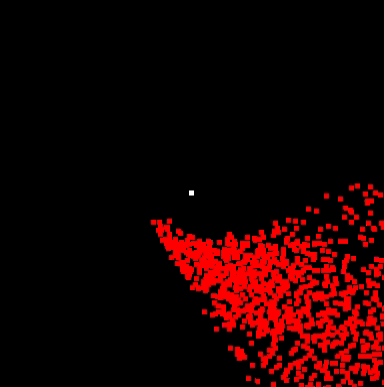
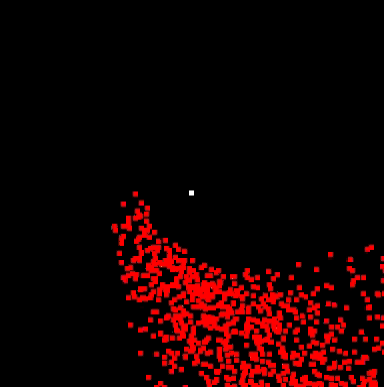
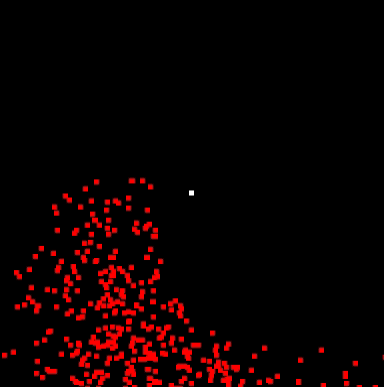
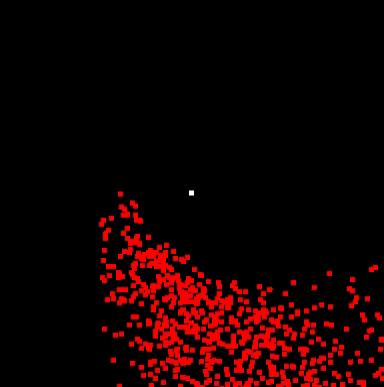
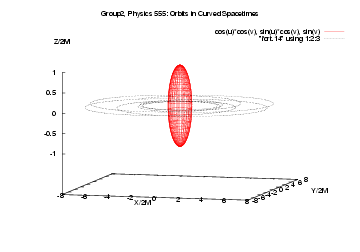
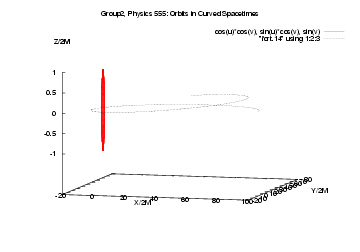
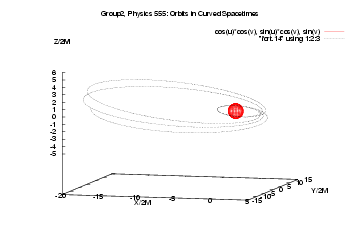
Our animations can be seen in the website in the form of mpeg movies. In what follows we show a few screenshots of some of those animations, where we created initial data using a perl script (initgen.pl. These script uses three parameters: the radial velocity ![]() and angular velocities
and angular velocities ![]() and
and ![]() . From our experience from the first homework we know that circular orbits in a Schwarzschild space-time are unstable, and this provides lots of dynamics for the animations.
. From our experience from the first homework we know that circular orbits in a Schwarzschild space-time are unstable, and this provides lots of dynamics for the animations.
 |